Filter Characteristics
🎯 Learning Objectives
By the end of this topic, you should be able to:
- In this topic we will look at what a filter is, and narrow our focus on digital filters.
- We will look at ways of analyzing the behavior of a filter by studying the characteristics of the filter, it's frequency and phase response.
What is a Filter?
By an incredibly broad definition any medium through which a music signal passes can be regarded as a filter,
however we do not usually think about something as a filter unless it can modify the sound in some way.
The different wobble sounds in speech are produced by changing the shape of the mouth cavity which changes the resonance and
hence the filtering characteristics of the vocal tract. Every microphone has a pickup pattern. So speaking into the front of
the microphone has different filtering characteristics when compared to. When we think about it everything is a filter.
But really what we are interested in topic are digital filters.
Digital Filter:
An algorithm or computation which takes one sequence of numbers, which is the input signal, and produces a new sequence of numbers, which is a filtered output signal, generally the amplitudes of the different frequencies of the signal are modified by the filter. And in consequence in most cases would modify their phase relationships as well.
Frequency Response of a Filter:
So visualize the frequency changes that are imparted by a filter, we need to analyze a frequency response graph.
The frequency response graph shows how a filter modifies the frequency content of a signal.
The frequencies are plotted logarithmically on the x-axis and the relative output amplitudes of the frequencies in decibels on the y-axis.
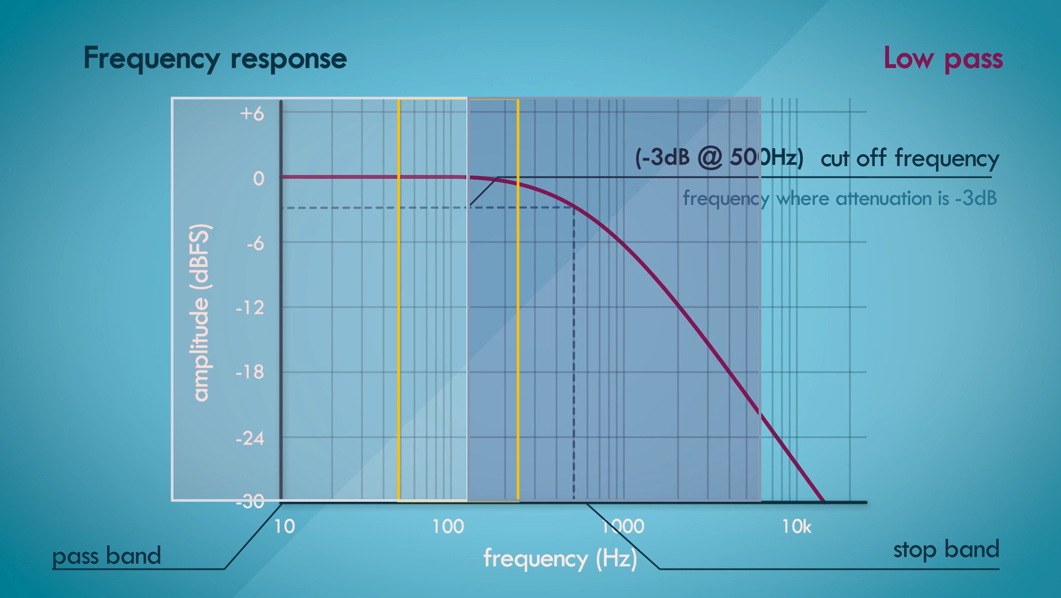
There are plenty of different types of filters but let us look at a fundamental one, a low pass filter as show in the Gigure below.
It allows low frequencies to pass through it while attenuating higher frequencies.
Here, in the Figure, we can see that the filter starts attenuating frequencies around shaded area and this region is determined by the cutoff frequency.
Technically, it has the frequency at which the attenuation is -3 dB.
For this reason it is also called the -3 dB frequency. In this graph the cutoff frequency is 500 Hz.
The frequency band up until 500 Hertz is called the pass band and the frequencies above it are called stop band.
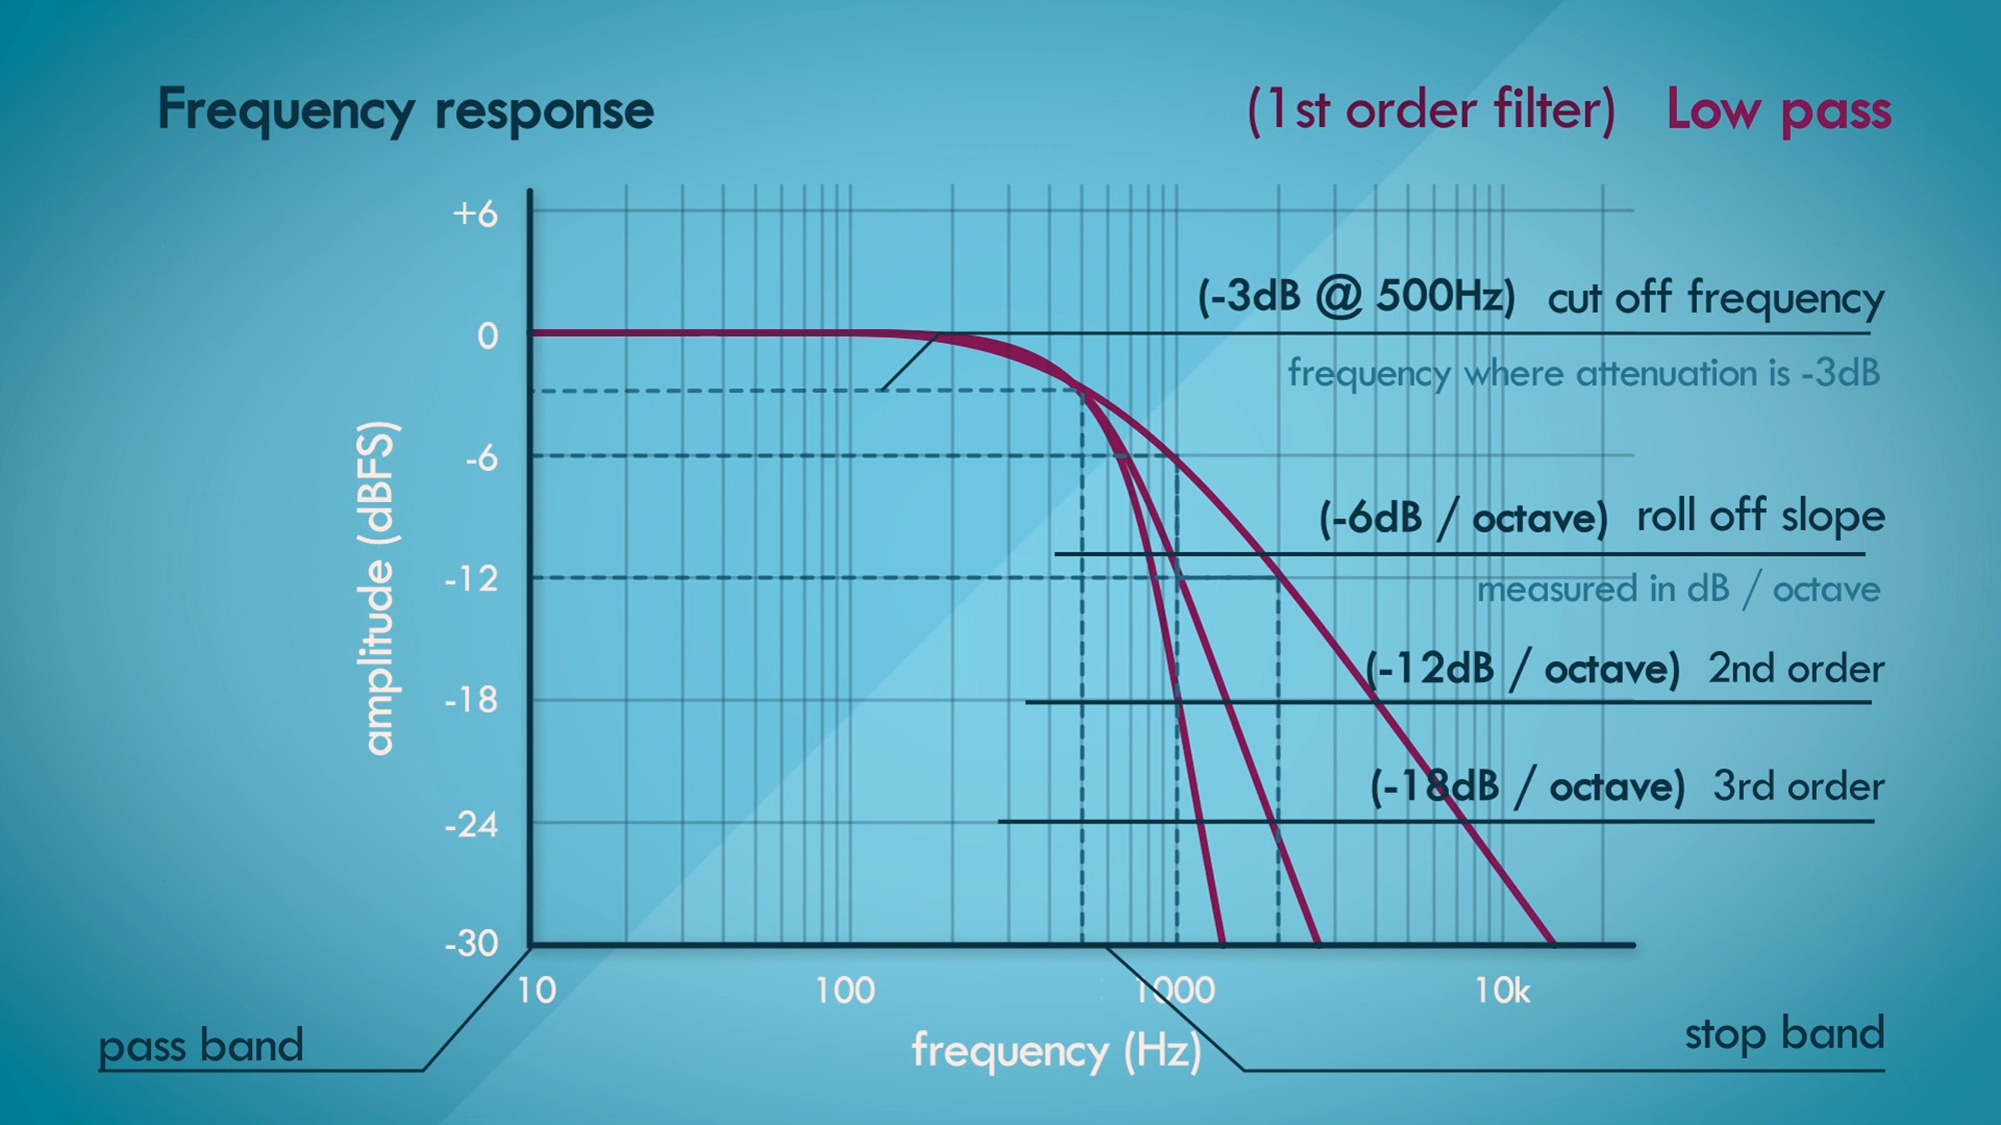
As cutoff frequency does not just cut off all frequencies above it but rather rolls off the frequencies. In the next Figure below the roll-off slope is gradual. The slope of the roll-off is measured in dB/Oct (decibels per octave), meaning how many decibels of attenuation happens in each octave in the stop band. We can see that at 1 kHz, which is one octave above our cutoff frequency of 500 Hz. The total attenuation is -6 dB and at 2 kHz which is another octave up, it is -12 dB, So we can characterize the roll-off for this filter as -6 dB/Oct. This is coincidentally called A first order filter. The order of the filter determines the steepness of the slope.

So our second order filter would have a roll off of -12 dB/Oct. A third order filter would have roll off of -18 dB/Oct and so on. This is illustrated in the following Figure.
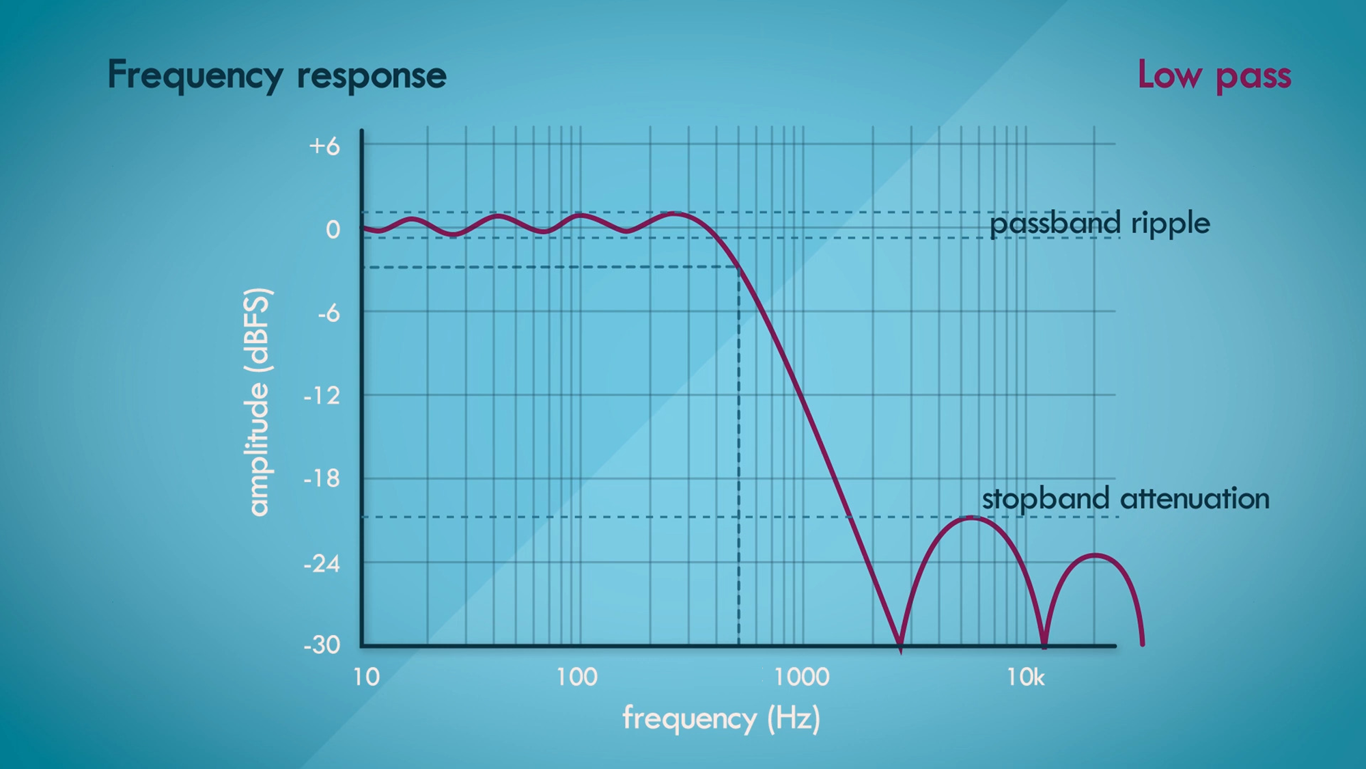
Let us simplify the filter characteristics on our need to know basis here really. For filter orders higher than one we will have to deal with pass band Ripple and stop band attenuation as show in Figure below. But will not be looking at those characteristics in this topic.
We can quickly hear what a low pass filter sounds like and put these terminologies in practice. Let us watch this demo made in REAPER.
Phase Response of a Filter:
Another important aspect of filters is the phase response and similar to a frequency response.
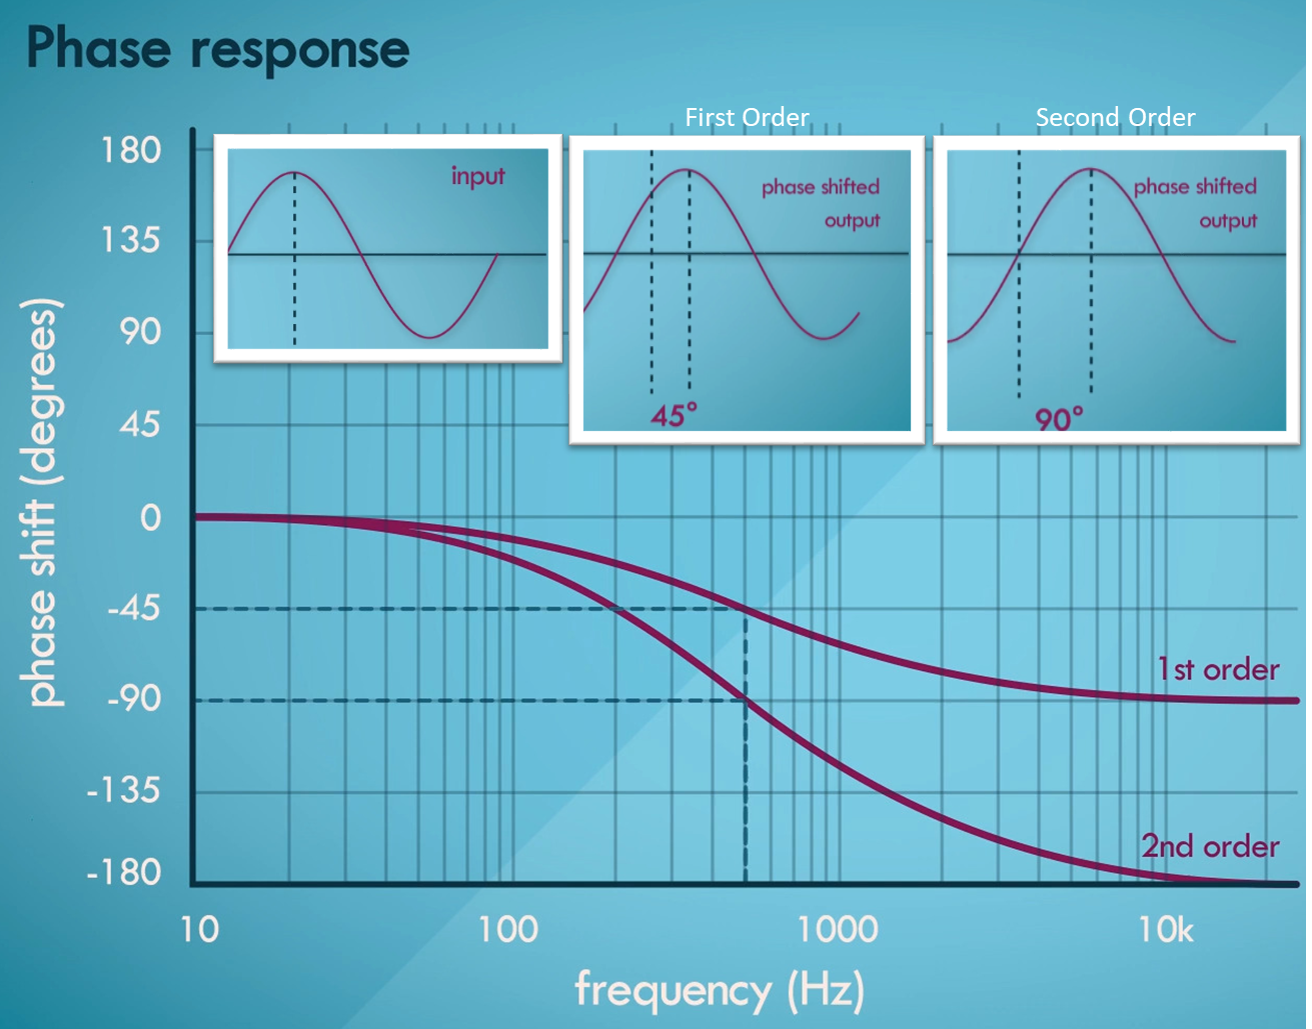
We have a phase response graph the frequencies are plotted logarithmically on the x-axis and the relative shift in phase of the frequencies in degrees on the y-axis.
The curve in the Figure below is a phase response of the first order low-pass filter.
This is not so intuitive from first glance and does not lend itself to be very useful or insightful but becomes a valuable tool once we begin to understand more.
We can see that the cutoff frequency of 500 Hz has a phase shift of negative 45 degrees.
This means that if a 500 Hz sinusoid is passed through the filter the output signal will be out of phase by 45 degrees or in other words delayed by an eighth of its wavelength.
For a second order low pass filter the phase response is quite similar.
It is just that the amount of phase shift seems to be doubled Another way to visualize this would be through the time domain.
So far we have looked at audio visualized in the frequency domain which may or may not be intuitive for us.
So this section will pretty much be the same as well but wholly visualized within the time domain.
let us say that we have four sinusoids of different frequencies, amplitudes and starting phases.
But for simplicity's sake, let us just going to keep their amplitudes the same and their starting phase as zero.
Addinf these sinusoids will give us a complex waveform.
If we can combine or synthesize a waveform using simple sinusoids then it makes sense that it should work the other way as well.
Fourier, mathematically showed that any complex waveform can be broken down or decomposed into a distinct set of sinusoids of different frequencies, amplitudes and phases.
So it is a reversible process.
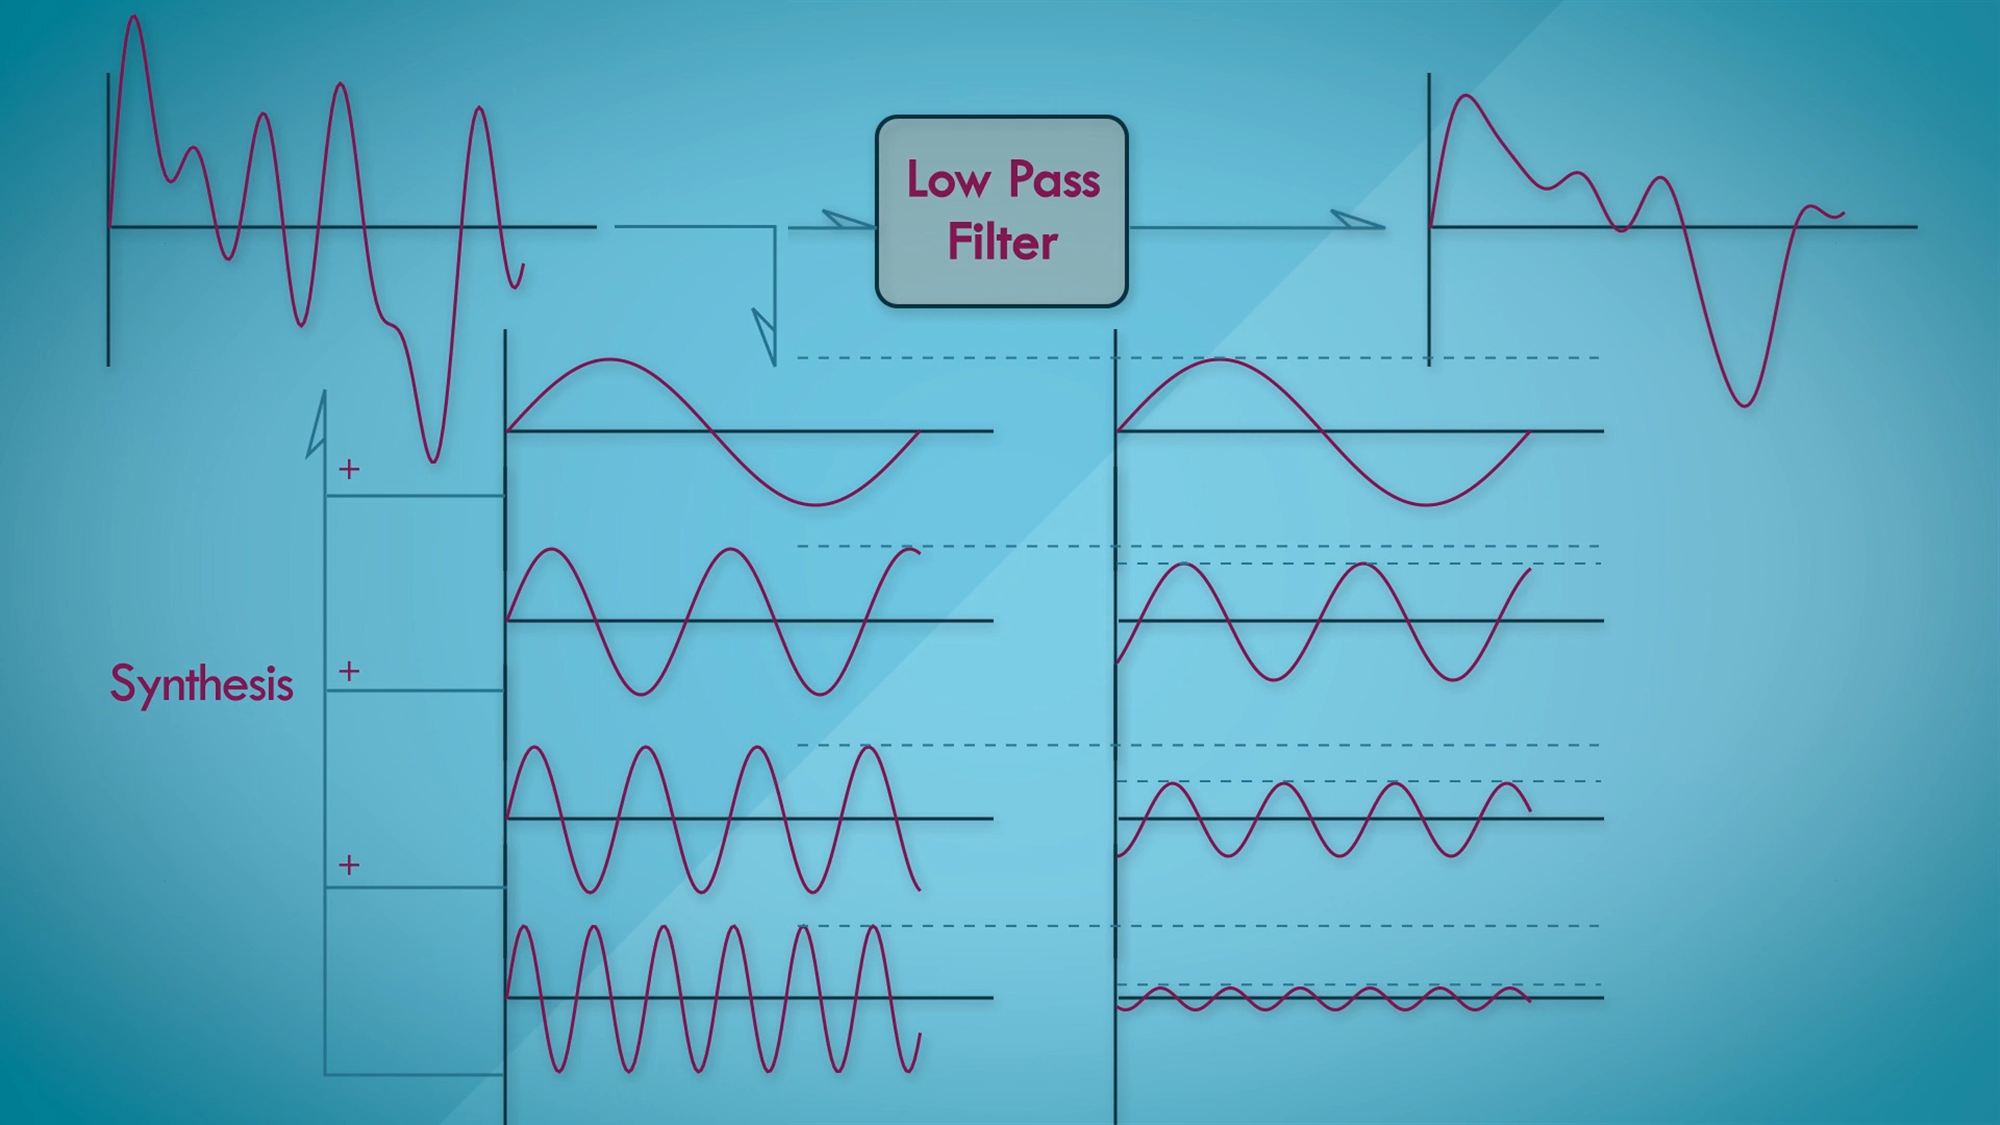
Let pass this waveform through the first order low pass filter, that we were talking about earlier,
would get a filtered output signal which is more or less a smooth version of the input signal. We will talk about later why
that is the case. If we apply Fourier decomposition we will get a set of sinusoids that it is made up of and would get something
like as shown in the Figure. The fundamental frequency does not seem to have altered at all and every harmonic after the fundamental
seems to be attenuated with decreasing amplitudes. As they go higher in frequency moreover the starting phase seemed to be altered for
the harmonics as well, with a larger phase shift noticeable for higher frequencies. This is entirely congruent with the frequency domain analysis that we saw.
The higher the frequency the lower its amplitude on the larger the phase shift. Since the high frequency components are diminished after filtering
we get less spikes in the output signal since the spikiness in the time domain is caused by high amplitude high frequency partials.
That is one of the reasons that a low pass filter is also called a smoothing filter. If we have an erratic control signal and want to smoothen
it out, a simple choice would be to go for a low pass filter with an appropriate cutoff.
So we have learned that: What a filter is, what it does and how to observe what it does
But why does it do, what it does. A fairly obvious questions that we may have at this point of time are: How do frequencies become attenuated or phase shifted through the digital filter and why are some frequencies affected more than others? These are some of the questions that we will try to answer in next topis.
🎨 Visual Demonstration
Interactive Filter Response & Audio Demo
Cutoff Frequency: 800 Hz
Filter Order: 2
How to Use the Demo
- Upload an audio file to apply filter interactively.
- Select filter type: low-pass, high-pass, or band-pass.
- Adjust cutoff frequency and order to hear changes in real-time.
- Toggle between amplitude and phase response visualization.
- Click "Play Audio with Filter" to listen to the processed audio.
🧠 Key Takeaways
- Everything acts as a filter, but in audio we focus on digital filters that intentionally modify sound.
- Digital Filter: An algorithm that takes an input signal and outputs a modified signal by changing frequency amplitudes and phases.
- Frequency Response: Visual representation of how a filter affects frequencies (frequency on x-axis, amplitude in dB on y-axis).
- Low-Pass Filter: Allows low frequencies to pass while attenuating higher ones; cutoff frequency is defined at −3 dB.
- Filter Order controls roll-off steepness:
- 1st order → −6 dB/Oct
- 2nd order → −12 dB/Oct
- 3rd order → −18 dB/Oct
- Higher-order filters may introduce characteristics like passband ripple and stopband attenuation.
- Phase Response describes how much different frequencies are delayed after filtering; higher frequencies often have larger phase shifts.
- Time-domain effect: Removing high-frequency components smooths the waveform — why LPFs are also called smoothing filters.
- Fourier connection: Complex waveforms are made of sinusoids; filtering attenuates and phase-shifts these components, shaping the final output.
🧠 Quick Quiz
Test your understanding of digital filters:
1) What does a low-pass filter primarily do?
2) At what point is the cutoff frequency of a filter defined?
3) What is the roll-off rate of a first-order low-pass filter?
4) Why is a low-pass filter sometimes called a smoothing filter?
5) What does the phase response of a filter show?